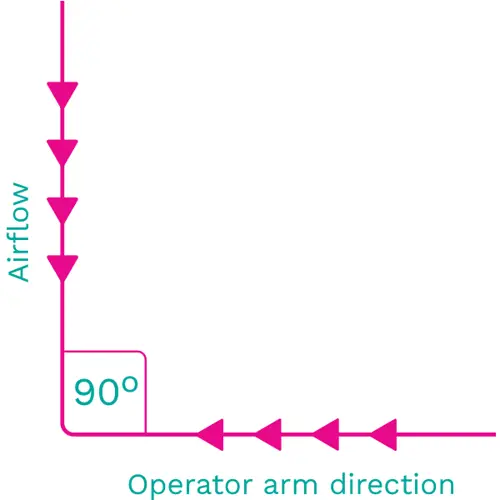
Probe location and orientation
Isokinetic probes should be situated at working height and within 30 centimetres of the critical area. For general cleanrooms, where there is no specific working height, counters should be placed around 1 metre from the floor (this avoids detecting particles too close to the floor that will be swept up as operators walk and avoid sampling too close to the HEPA filter). Probes should be pointed in a direction such that the probability of detecting particles is maximised.
Incorrect probe
As isokinetic probes are of different designs for different types of particle counters (based on the flow rate of the counter), errors can occur when the wrong one is used. The main danger is with artificially high particle counts, such as when the inlet velocity is less than the calculated probe velocity. In this situation, the sample results will be biased high (i.e., oversampled) due to inertia.
Particle inertia is the main mechanism involved in sampling errors when there are non-isokinetic conditions. These deviations can be as high as 50% for particles above 10 µm in size (decreasing as particles become smaller).2
Placing a probe close to a HEPA filter
Underreporting
Unless scanning a HEPA filter for leakage, particle counter probes must not be placed directly under a HEPA filter. Probes should be directed towards the area surrounding the product and not towards clean air flowing directly out of the HEPA filter.
Tubing
Underreporting
Where tubing is required (from the isokinetic probe to the particle counter), it should be no longer than 1 metre, have no more than three bends, with any bends having a radius of 15 centimetres or greater 3. This is necessary to safeguard against particle loss (especially where larger particles adhere to the inside of the tubing). These factors are not ‘targets’ - it is preferable that transport tubing length should be kept as short as possible with as few bends as possible 4.
The greatest impact is on ≥5.0 µm particles due to the ‘relaxation time’. This is defined as the time for a particle (initially in equilibrium with a moving fluid) to match a change in fluid velocity. Large particles have a long relaxation time. Therefore, when an air stream moves through tubing that contains small-radius bends or elbows, the large particles will deposit on a tube wall because they cannot easily adapt to sudden velocity changes, continuing in their original direction until they impact on the tube wall 5.
The diameter of the tubing and the tubing material can also play a role (the material should be static neutral e.g. Bev-a-Line (Hytrel)* or stainless steel). These collectively result in ‘tubing loss’.
*This type of tubing is not suitable for long-term use areas where vapour hydrogen peroxide is used unless it is subject to regular replacement (see below).
Tubing loss is caused by:
1. The impaction of particles onto the walls of the transport tubing
2. Sedimentation or gravity
Potentially, particle counters with faster flow rates have lower particle loss (however, calculating intra-tubular turbulence is not straightforward) 6.
Tubing replacement
Over time, the sample tubing will need to be replaced due to macroparticle build-up from impaction and sedimentation forces that result in particle losses.
Overreporting
While the above factors are typically associated with underreporting, it should be noted that particle loss will eventually result in a sudden release of particles and unusually high ≥5.0 µm particles, that have nothing to do with the actual conditions inside the clean area, can be erroneously reported.
Flow rate
Underreporting
To take a sufficiently large sample size, particle counters must sample at least 28.3 litres per minute (equivalent to one cubic foot per minute).
Coincidence loss
Underreporting
Coincidence loss occurs when two or more particles pass through the sensing volume simultaneously, making it difficult for the counter to distinguish them as individual events.
False counts
Overreporting
Particle counters are prone to occasionally recording false counts. This is a product of the use of lasers to measure particles. A small number of counts are likely to be the result of electrical noise. Solar flares and other cosmic events can result in spikes of electromagnetic radiation. A radiation spike can strike the particle counter’s photodetector - this will register as the energy that is indiscernible from the light scatter.
False counts rarely occur consecutively, but they can sometimes account for one or two ≥5.0 µm counts within a cubic metre of air where these are not linked to any event. This may be especially notable under Grade A.
A low signal-to-noise ratio (S/N) can also produce resolution degradation by allowing artefacts (noise pulses) to be counted as particles. This will be noticeable when the counter is calibrated, and the as-found state can be compared to the adjusted state 7.
Counting Efficiency
Underreporting
Particle counters may have limitations in accurately counting smaller particles (e.g., those less than 0.3 μm), potentially leading to skipped data or underreporting for these sizes.
The process of designing optical particle counters is a trade-off between reducing noise generated by the system and increasing the signal coming from the particles. The sources of noise can be the light source itself, the optics used to shape the light, window surfaces/capillary walls, the molecules of the sample fluid, or the electronic circuits used to collect and process the scattered light. Particle counters with detection limits greater than 100 nm can illuminate the sample cell walls while maintaining acceptable signal-to-noise ratios. The ability to illuminate the entire sample cell with the uniform portion of the light source (typically a laser) makes these instruments volumetric and provides a well-defined sample volume for the particles of interest.
Purging
Overreporting
Counters need to be purged before use. Before sampling, a False Count Test should be conducted. This will verify the absence of internal contamination of the particle counter and ensures that no electronic noise problems exist that would produce false-high counts.
For this test to be satisfactory, for each one-minute sample of the purge, the counts obtained should be no more than 10% of the counts typically obtained in the cleanest area to be monitored for the ≥0.5 µm. Under the purge test ≥5.0 µm particles, should not be routinely recovered - if they are recovered, they should not occur consecutively. It is preferable to perform this test under a Grade A device.
If the counter meets the criteria, the purge test is re-run using a purge filter positioned on top of the counter.
Purge failures without the purge filter probably indicate internal sensor contamination. Purge failures with a purge filter in place probably indicate a filter that has become contaminated (which will occur after a filter has been used too many times or if the filter has become damaged).
The purge test cannot tell if a counter is undercounting.
Contamination of the counter
Overreporting
As indicated above, particle counter sensors can become contaminated. Ideally, this will be shown through purging studies.
Sometimes data patterns indicate potential contamination. For example, it is normal to see that when a true event occurs, the pattern of ≥0.5 µm particles remains constant, whereas the pattern of ≥5.0 µm particles starts high and then drops off. This is because ≥5.0 µm particles tend to settle quickly due to gravity, whereas ≥0.5 µm particles will remain in the airstream until they are removed by air exhaustion.
As an example, if an operator walks through a room or performs an activity that suspends particles into the air, 5.0 µm particles will fall out more quickly than ≥0.5 µm particles. Conversely, if ≥5.0 µm particles remain relatively steady, this may be a sign of counter-contamination (or an atypical particulate source).
Contamination due to counter-transportation
A source of contamination can occur when transporting a counter between areas, including when a counter is removed for calibration. When portable counters are transported between areas, the effectiveness of measures taken to avoid cross-contamination is important.
Contamination due to vapour hydrogen peroxide
Particle counter tubing can become contaminated with hydrogen peroxide. Some material types are more prone to contamination than others.
Bev-A Line (Hytrel) is not compatible with vapour hydrogen peroxide when exposed to repeat applications. Typically tubing needs to be changed every three months to avoid contamination/damage.
Averaging or extrapolating particle counts
Data is not representative
Particle counts should not be averaged or extrapolated for routine monitoring. Contaminants are introduced into the cleanroom from finite points and their subsequent distribution is generally limited or sporadic, with particles rarely following homogenous distribution 8.
Therefore, averaging or extrapolating data misinterprets the data distribution.
Not using a delay time
Overreporting
It is good practice to let the air settle before taking a sample. It is recommended to program a minute or two delay into a particle counter so that the sampling begins after the air in the sample area is allowed to settle.
When cleanrooms are monitored, the person taking the sample should step back at least three metres to allow the air to settle and avoid being the subject of the monitoring.
Calibration issues
Underreporting or overreporting
Incorrect or outdated calibration can result in inaccurate particle sizing and counting, potentially leading to data that is not representative of the actual particle concentration 9.
Calibration is assessed as the difference between ‘left data’ (the counter as it is presented for calibration) and ‘receive data’ (the recording of data after any adjustment). Calibration is performed to ISO 21501-4: 2018 (amended 2023) 10.
ISO 21501-4 provides a calibration procedure and verification method for airborne particle counters to minimise inaccurate measurements and reduce variations between different instruments. Laboratories performing calibrations should be ISO 17025: 2017 11 accredited.
Poor Placement
Data is not representative
Placing the particle counter in an area that is not representative of the overall cleanroom environment can lead to biased data.
Malfunctioning components
Underreporting
Problems with the laser, photodetector or other critical components can lead to inaccurate data or even complete data loss.
For example, laser alignment is a critical factor. If the laser is not aligned correctly, the particle count accuracy will be wrong - misalignment will have the same effect of missing particles and the overall result will be inaccurate. The photodetector converts the scattered light as photons into electrical pulses by creating a charge for each received photon.
Sample inlet issues
Underreporting or overreporting
Problems with the sample inlet, such as leaks or clogging, can affect the flow rate and introduce errors in the particle counts.
Data loss
Data loss can occur due to data transmission errors or when counters are deactivated (either due to power supply issues or due to human action).
Data transmission
Data is not representative
Breaks in communication between the counter and a server can lead to underreporting where one or more minutes of data is not recorded.
Counters deactivated
Data is not representative
Counters can sometimes be switched off in error or data can be lost due to electrical disruption.
In the event of a data loss, the most important activity is to undertake a trend assessment using available data (before and after the incident). The risk elevates partly as a result of the time of the data loss and partly based on whether any activity is taking place.
Occasional data losses of one or two minutes can occur within a cubic metre. Provided these are infrequent, they are not likely to be significant. Should they occur frequently, an engineering review is required.