This article explores the principles behind ACH, why it matters and how it is measured within cleanroom environments.
What is the ACH?
In a cleanroom ACH is measured by determining the volume of air supplied to the room and dividing it by the room volume. It is not measured directly as a single parameter but calculated from airflow measurements.
The core calculation is:
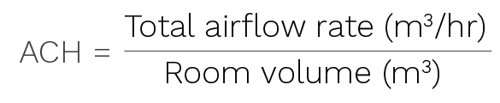
Regulatory guidance, including the European Pharmacopoeia (EU) and the Pharmaceutical Inspection Co-operation Scheme (PIC/S) Annex 1 (2022), do not prescribe fixed ACH values. However, the ACH is expected to be calculated to demonstrate that airflow is sufficient to maintain the required cleanroom classification. This needs to be established during initial cleanroom qualification and verified periodically.
Typical industry ranges are:
| Grade |
Typical ACH |
| Grade B |
20-60 ACH |
| Grade C/D |
10-25 ACH |
How airflow is measured
Air change rates in a cleanroom are determined by measuring total supply airflow (via velocity or airflow hoods) and dividing by room volume. This calculates how many times the air is replaced per hour. The measurement of airflow can be performed in different ways 2:
1. Supply air velocity measurement
This requires measuring air velocity at HEPA filter face or supply diffusers using an anemometer (hot-wire or vane design). With the readings taken, the next step is to multiply:

Then, take the sum of all the supply points within the cleanroom.
2. Airflow hood
This method requires the placement of a balometer / airflow hood over each supply diffuser, which directly measures volumetric airflow (m³/hr).
3. Duct airflow measurement
This method requires measurements of the flow inside Heating, Ventilation and Air Conditioning (HVAC) ducts to be taken, using a Pitot tube and flow stations.
Of the three methods, the supply air velocity measurement is the most common. There are some indirect methods as well - these should not be used instead of the above methods, but they can support the assessment. These methods are:
- Smoke visualisation: This qualitative measure confirms airflow patterns and direction, but it does not measure ACH directly.
- Tracer gas decay: This technique involves the release of a tracer gas (such as CO₂, SF₆, or helium), from which it is possible to measure decay rate over time. This enables an engineer to calculate actual air exchange effectiveness. With this method, a known quantity of an inert tracer gas is released into the room. As clean air is supplied and contaminated air is removed, the gas concentration decreases (decays) over time. This can reveal the impact of:
- Poor mixing
- Dead zones
- Air short-circuiting
Example calculation
Using data collected from either the supply air velocity measurement or from the air hood, an example ACH calculation is:
- Room volume = 100 m³
- Total supply airflow = 4,000 m³/hr

Requalification
As well as periodic testing (e.g. every six months for higher grade cleanrooms or annually for lower grade cleanrooms), it is also important to reassess ACH values after any HVAC changes, especially room supply fans.
Seeking energy savings
There is a strong interest in reducing ACH in cleanrooms because HVAC systems are one of the largest energy consumers in pharmaceutical manufacturing. ACH is a primary driver of that energy use 3.
Cleanrooms require:
- Continuous high-volume air supply
- HEPA filtration
- Temperature and humidity control
This means the higher the ACH, the more air that must be moved, filtered, heated/cooled - hence the higher the fan power and conditioning load. In other words, energy demand increases roughly in proportion to airflow volume, but fan energy can increase exponentially with flow rate.
A major draw on energy is the fan. Fan power ∝ (airflow) (as an approximate relationship). Therefore, even a small reduction in ACH can deliver large energy savings. For example, reducing ACH by 20% can reduce fan energy by ~40–50%. Since cleanroom performance depends more on airflow design than ACH alone, many firms are seeking to optimise airflow. While this is laudable, the impact on contamination and other factors must be assessed 4.
A suggested approach is 5:
Check that environmental performance is maintained
- Viable and non-viable particles within limits
- Trending remains stable
Assess recovery capability
- Cleanroom returns to specification quickly after contamination
Examine airflow effectiveness
- No dead zones or short-circuiting
- Confirmed via:
- Smoke studies
- Tracer gas (optionally)
Perform a Quality Risk Assessment based on
- Process criticality
- Grade (A vs C/D)
- Occupancy levels
An example risk assessment, for a Grade C room, can be used to assess whether a room is suitable for ACH reduction:
| Factor |
Risk level |
Rationale |
| Room grade (C) |
Moderate |
Less critical than Grade A/B |
| Process type |
Low–moderate |
Closed/semi-closed |
| Operator density |
Moderate |
Intermittent occupancy |
| Historical EM data |
Low |
Stable over 2+ years |
A risk-based approach would also reduce ACH rates gradually and assess each step. For instance ACH reduction in controlled phases:
| Phase |
ACH |
Duration |
Controls |
| Baseline |
22 |
- |
- |
| Step 1 |
18 |
4 weeks |
Enhanced EM |
| Step 2 |
15 |
4 weeks |
Enhanced EM |
| Step 3 |
12 |
8 weeks |
Full qualification |
Reducing ACH is pursued because cleanroom airflow is a major driver of energy consumption, and optimising (rather than maximising) airflow can deliver substantial cost and sustainability benefits without compromising GMP compliance when supported by robust performance data6.